
2500+
Successful Projects

Did you know that the average mobile app loses 90% of its active users within the first three months? That might not be encouraging data, but what works here is continuous improvement and adaptation. But how do you know how your app is performing, how users are interacting with it, and whether it caters to their preferences and needs? In such a situation, Key Performance Indicators (KPIs) turn out to be the best way to measure the app's performance based on several aspects.
Table of Contents
However, the biggest challenge persists in choosing the right KPI to track. If a single step goes wrong, you may miss an opportunity to enhance your app’s effectiveness. There is no dearth of KPIs available for tracking mobile app performance, and this abundance of options gives nothing but confusion. Remember, tracking the wrong KPI may waste your resources and lead to losing sight of your goals.
So, to help you choose the best KPI for your mobile app, we have created a list of the top 30 app KPIs from the three most crucial categories: App engagement, User experience (UX), and performance and Revenue. So, let’s get started!
Key Performance Indicators (KPIs) are crucial metrics that measure the effectiveness and performance of a mobile app. They assist in monitoring the achievement of particular objectives and in enhancing user interaction.
The KPIs to focus on are determined by the nature of your application. For instance, for a gaming application, you would be interested in KPIs such as the number of users who are active daily and the average income generated per user.

On the other hand, if your application is centered around social media, you would place more emphasis on KPIs like the total count of subscribers and the number of times content is shared socially.
The mobile app industry is fiercely competitive, with over 257 billion apps being downloaded in 2023. Monitoring the appropriate Key Performance Indicators (KPIs) can help you expand your business and differentiate yourself from competitors.
Here’s how measuring KPI for mobile apps is essential for your business:

App KPIs offer quantifiable standards for evaluating your app's performance and success. The correct KPIs can help you ascertain whether your strategies are yielding the desired results.
User acquisition is a commonly used app KPI. Monitoring this metric allows you to evaluate the success of your acquisition strategies and make necessary adjustments.
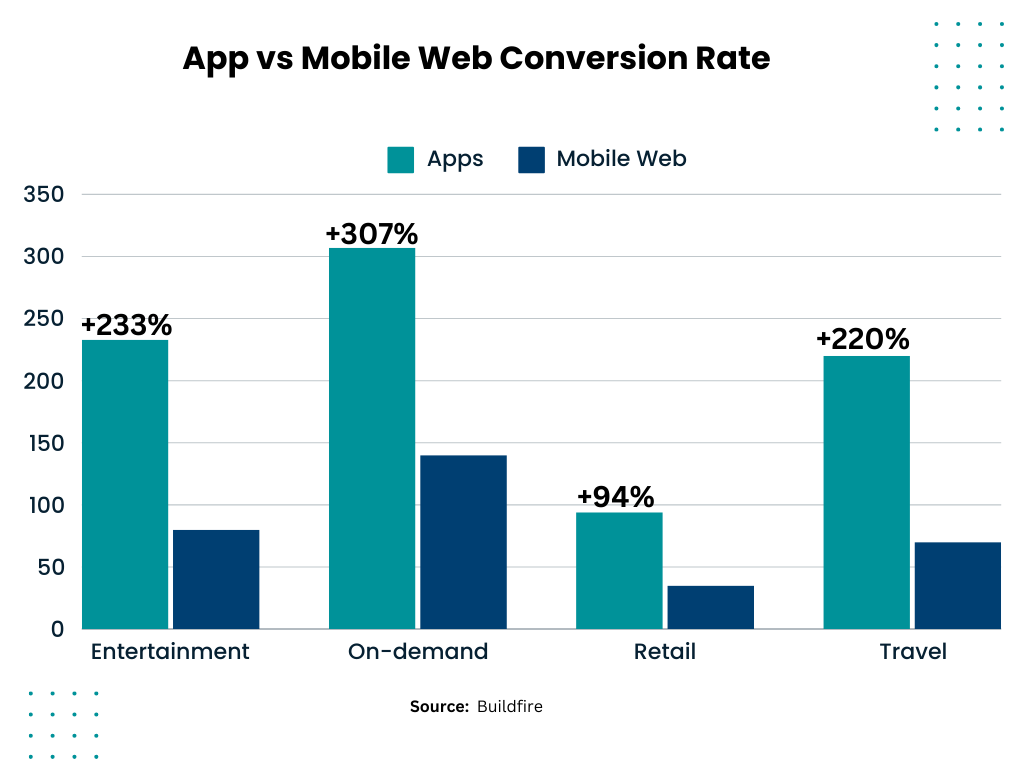
The graph below illustrates churn rates — the proportion of users who discontinue using an app — across various industries:
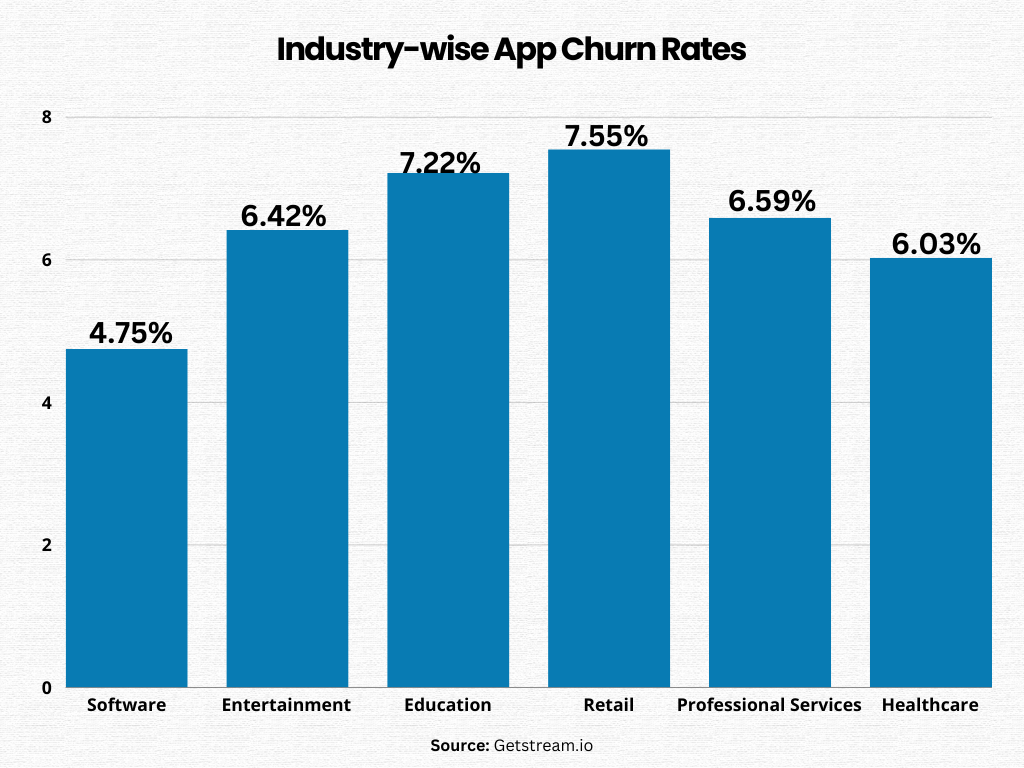
Churn is a common and distressing problem for mobile app owners. However, monitoring the appropriate KPIs can help identify the stages at which users are leaving and formulate strategies to enhance retention.
To help our readers in choosing the right KPIs for their mobile app, we have divided them into three key categories:
App engagement KPIs allow you to monitor the key metrics to understand user interaction with your app and pinpoint areas that need enhancement:
DAU is a KPI that measures the distinct users interacting with your app daily. This metric is instrumental in assessing your app's daily usage and expansion.
Calculation method:
DAU = Number of unique users who use your app within a 24-hour period
MAU measures the distinct users who interact with your app each month. This metric is useful in evaluating your app's monthly growth.
Calculation method:
MAU = Number of users who engage with your app within a 30-day period
The stickiness ratio or the user retention index provides insight into your app's "stickiness" by quantifying the frequency of users returning to your app. A high ratio signifies high engagement rates, with a larger proportion of daily users.
Calculation method:
Stickiness ratio = DAU / MAU
Session length is the duration a user spends on your app from the moment they open it until they close it. This metric can help ascertain if users remain on your app long enough to complete a desired action. Apps like Facebook and Instagram excel in this KPI, with an average user spending 55 minutes per day on these apps.

Calculation method:
Average session length = Total session length / Number of sessions
Views per session measures the average number of views your users have in a single session. It can suggest whether users find your app engaging enough to explore more.
Calculation method:
Screens per session = Total screen views / Total sessions
User retention rate monitors the number of users who revisit your app after downloading it. A high retention rate suggests that users are finding value in your app.
Calculation method:
Retention rate = (Monthly active users / Total app installs) x 100
The churn rate is a crucial metric as it quantifies the percentage of users who discontinue using your app. A high UAR could signal issues like poor user fit or deficient features.
Calculation method:
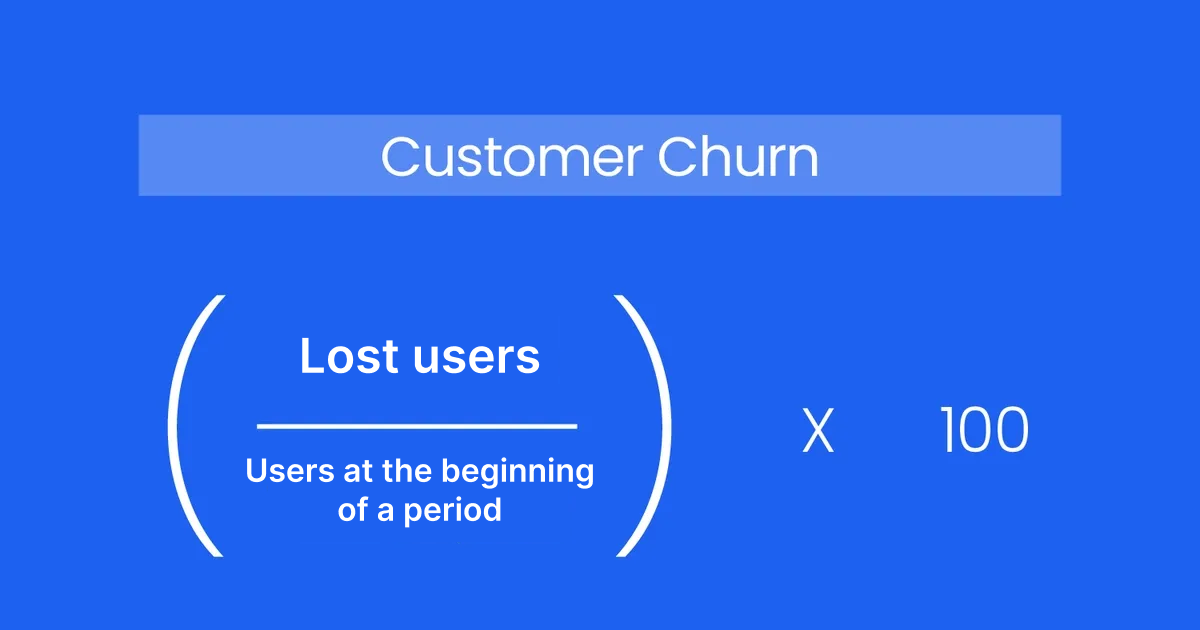
Churn rate = (Lost users / Users at the beginning of a period) x 100
Statistics reveal that 25% of apps are only used once after downloading. The app abandonment rate differs from the retention and attrition rate. This metric quantifies the number of users who download and install your app but don't complete the signup process.
Calculation method:
Abandonment rate = (Users who stop using the app / Total number of app users) x 100
The in-app action rate refers to the number of actions users perform within your app. Examples can include liking a post, making a purchase, or watching a video.
Calculation method:
In-app actions = Number of users who complete a desired action / Total number of users
Push notifications are potent tools that can enhance user engagement. Push notification engagement rate quantifies the percentage of users who engage with your notifications.
Calculation method:
Push notification engagement = (Number of users who interacted with a push notification / Number of push notifications sent ) x 100
Monitoring user experience (UX) and key performance indicators (KPIs) can help pinpoint and resolve issues within your app that may hinder users' effective navigation. So here are some key metrics to measure app UX and performance:
The speed of your app, which refers to the quickness of loading and executing functions, is crucial. If it's sluggish, users are likely to abandon it. Prioritize minimize loading times to provide a positive user experience.
Calculation method:
You can utilize tools such as Chrome DevTools or Safari Web Inspector to measure load times.
Latency, another metric of responsiveness, measures the duration between a server or API request and the receipt of a response.
Calculation method:
Chrome DevTools can be used to measure your app's latency.
This metric measures the proportion of users who successfully complete a specific task within your app. A low success rate may suggest usability issues with your app.
Calculation method:
Task success rate: (Number of completed tasks / Number of attempts) x 100
This tracks the count of errors or failures users encounter during a particular task, helping you pinpoint problematic areas within your app.
Calculation method:
Error occurrence rate = (Number of errors occurred / Total number of errors for all users) x 100
This measures how often users experience crashes while using your app. A low crash frequency indicates good app stability and performance.
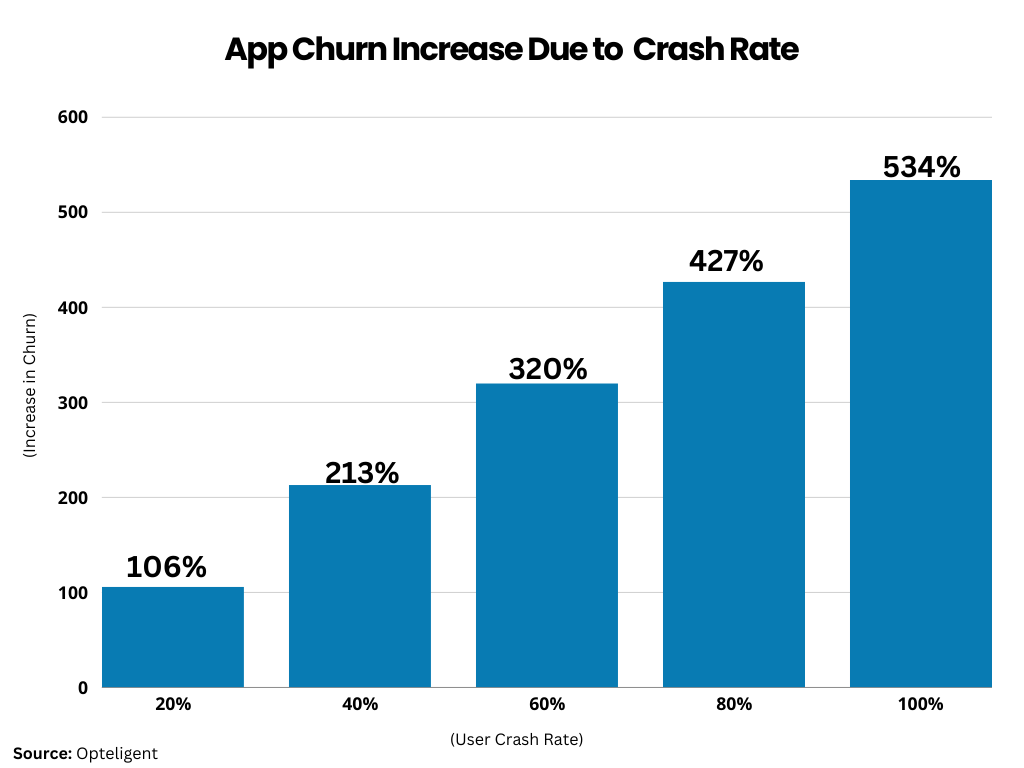
Calculation method:
Crash rate = (Number of crashes / Total number of app sessions) x 100
Monitoring your app's usage on operating systems like iOS and Android can offer insights into its performance across different platforms.
Calculation method:
Mobile analytics tools like Mixpanel or Amplitude can be used to identify the operating systems your users are using.
Understanding whether your users are using smartphones or tablets is vital, as these devices require different design and development considerations.
Calculation method:
Tools like Mixpanel or Amplitude can help determine your users' devices.
App ratings can provide a glimpse into the overall user sentiment towards your app. A sudden decrease in positive ratings could suggest user dissatisfaction with a recent update.
Calculation method:
You can view your app's rating data in the Apple App Store or the Google Play Store.
NPS is an effective way to gauge user loyalty. It asks users a single question: "How likely will you recommend our app to a friend or family member?"
Calculation method:
NPS = Percentage of Promoters - Percentage of Detractors
CSAT is another metric that quantifies user experience. It asks users to rate their satisfaction with your app on a five-point scale.
Calculation method:
CSAT = (Number of satisfied customers (those who rated four and five) / Number of responses ) x 100
Revenue Key Performance Indicators (KPIs) are crucial tools for evaluating your app's financial health and the success of your revenue generation strategies. So, here are some key metrics to measure your app revenue opportunities:
This KPI tracks the average time it takes for a user to make their first purchase within the app. Implementing in-app messaging via the Stream Chat API is one strategy to reduce this duration.
Calculation method:
Identify the event of the first purchase and monitor the average time users take to reach this milestone.
ARPU determines the average revenue generated by each user. It's a valuable metric for assessing the return on investment (ROI) of your app marketing and understanding your users' lifetime value.
Calculation method:
ARPU = Total revenue / Total number of users
Gross revenue quantifies your app's total earnings from all sources, such as in-app purchases, subscriptions, and ads. While it doesn't consider expenses, this metric can help track your app's financial growth over time.
Calculation method:
Total revenue = Average revenue per user x Number of users
AOV represents the average amount users spend per order. If you operate an eCommerce platform, this is a key metric to monitor and enhance.
Calculation method:
AOV = Total revenue / Number of orders
CLV estimates the revenue a business can expect from a customer throughout their lifetime. A high CLV indicates a strong product-market fit, as it suggests users are frequently returning to your app and making purchases.
Calculation method:
LTV = Average order value x Average purchase frequency x Average customer lifespan
This metric measures the frequency at which users complete a desired action, such as making a purchase. Strategies to increase in-app conversions include improving the onboarding process and integrating in-app chat.
Calculation method:
Conversion rate = (Number of users who complete a desired action / Total number of users) x 100
This metric evaluates the revenue your app generates from purchases made within the app, which can be one-time or recurring purchases of additional content.
Calculation method:
In-app purchase revenue = Total revenue - Revenue from other sources
This KPI monitors the revenue your app generates from user subscriptions. A consistent recurring revenue allows you to forecast future cash flow and manage your expenses effectively.
Calculation method:
Subscription revenue = Number of subscribers x Average subscription price
CPA calculates the average cost of acquiring a new user. You can break down AAC by channels to decide where to allocate your resources.
Calculation method:
CPA = Total advertising spend / Number of users acquired
RoI helps you monitor your app's profitability over time. It calculates how much your app earns for every dollar you invest in its creation and promotion.
Calculation method:
ROI = (Total revenue - Total cost / Total cost) x 100
The key performance indicators for mobile apps listed above cover all three critical categories. These metrics will keep you busy for your app’s lifetime. It is noteworthy that you don’t have to track everything overnight, just choose the KPI that seems more important to your app.
Fortunately, there are tons of free and paid tools for tracking KPIs. You can trust them to track the performance and growth of your mobile app. In the end, we only suggest taking time to select the right KPIs for your mobile app instead of trying out everything.
Questions? Reach out to our expert team at Mtoag Technologies, and we will be happy to share our expertise on mobile app KPIs and performance analysis.
Key Performance Indicators (KPIs) in a mobile app are metrics used to assess the effectiveness of the app in achieving its objectives. Examples include user engagement, session length, and retention rate.
Application performance KPIs are metrics that evaluate the app's functionality and responsiveness. These include load time, error rates, and crash rates.
Mobile app performance is measured using tools that track KPIs like load time, latency, error rates, and user satisfaction scores.
Yes, the number of app downloads is a crucial KPI. It indicates the app's popularity and reach among potential users.


Mobile app
Whether you have a breakthrough startup idea or are planning a digital transformation for your existing business, you will definitely need a mobile app to get started. However, without the technical know-how and budget to hire a mobile app development company, your dream project might remain just that—a dream. But luckily, technology has solutions to […]

Mobile app
As 2025 is just a few months away, we anticipate stepping into a more futuristic world. The year 2024 has been great in terms of technological advancements, with innovations such as Multimodal AI, Agentic AI, open-source AI, and Retrieval-augmented generation making their way into our lives. However, generative AI remains a hot topic and will […]

Mobile app
With technology making a significant shift toward a mobile-centric world, there has been a continuous surge in the demand for more personalized and advanced mobile apps. To cater to users’ diverse demands, identifying current trends and tracking user behavior have become more important for businesses. That’s where mobile app analytics can work wonders for your […]
Successful Projects
Years in Business
Happy Customers
We have been working with Mtoag Technologies for the past 5 years. They have been a very responsible team from the beginning. They are quick at responding, available whenever we need, and are extremely supportive when there’s a high-priority fix. All-inclusive, IAD can be your best bet for app development.